DEXAGA

Reimagining Business Intelligence

With On-Demand Reporting at your fingertips

What is Dexaga?

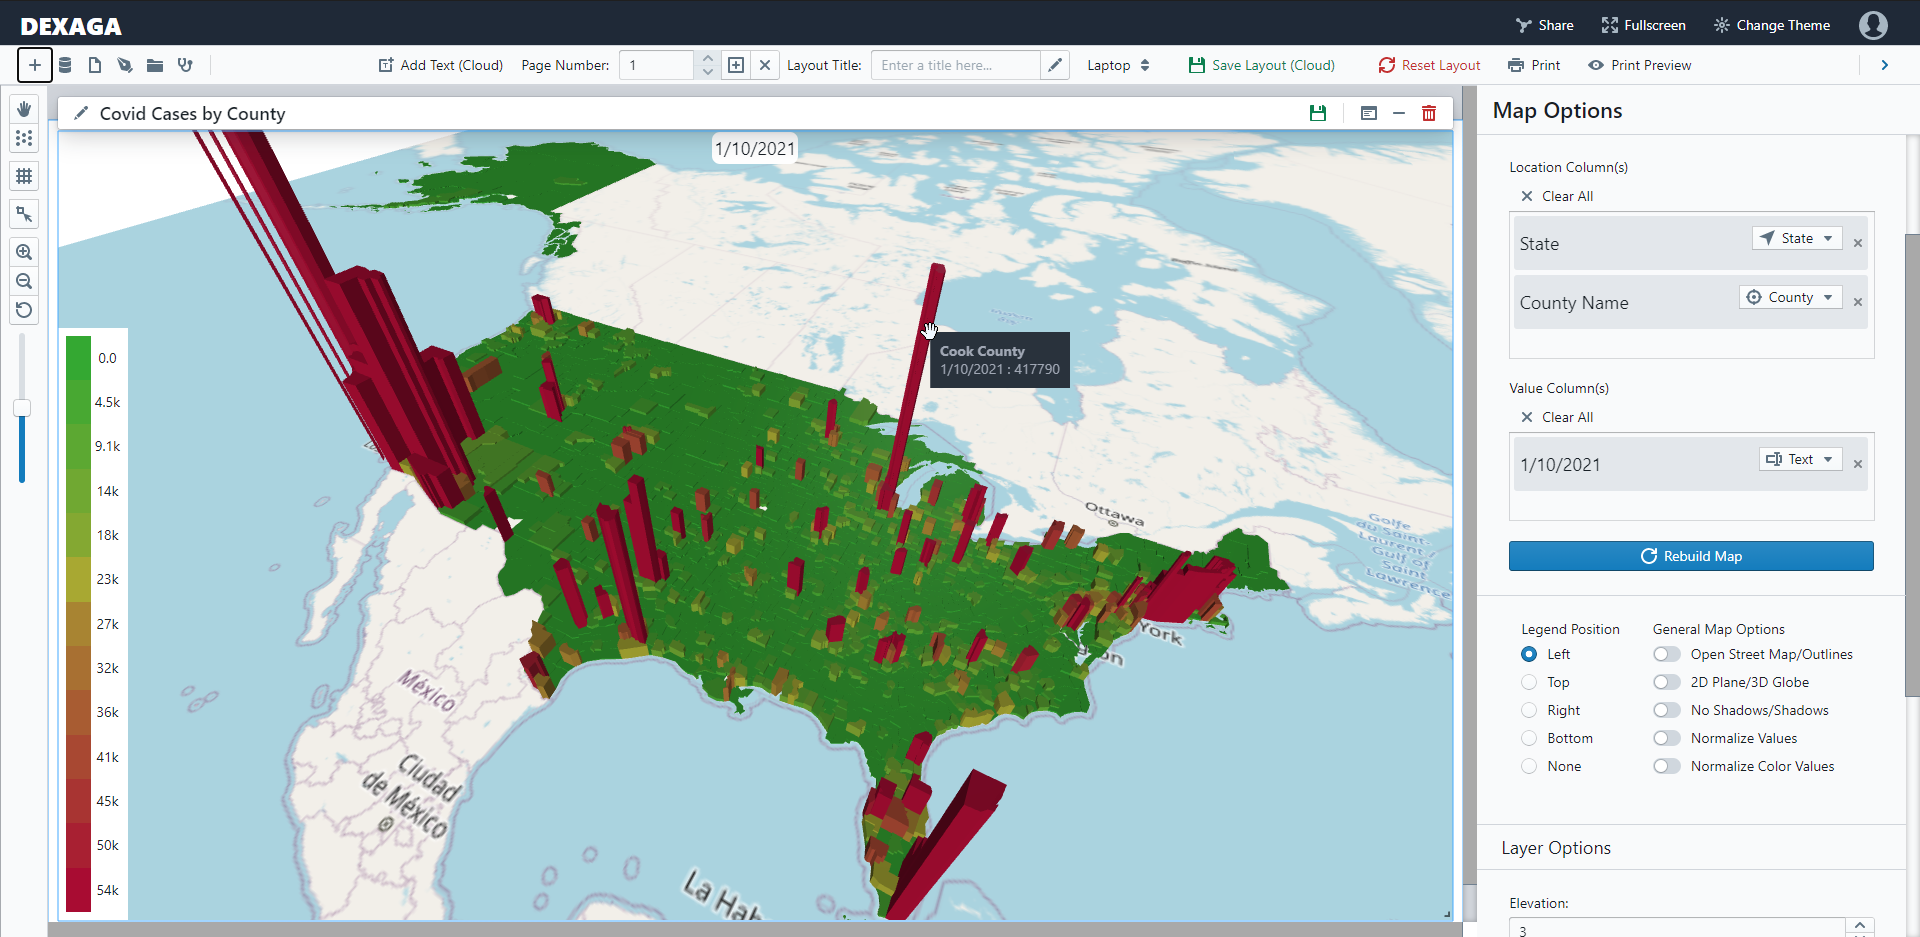
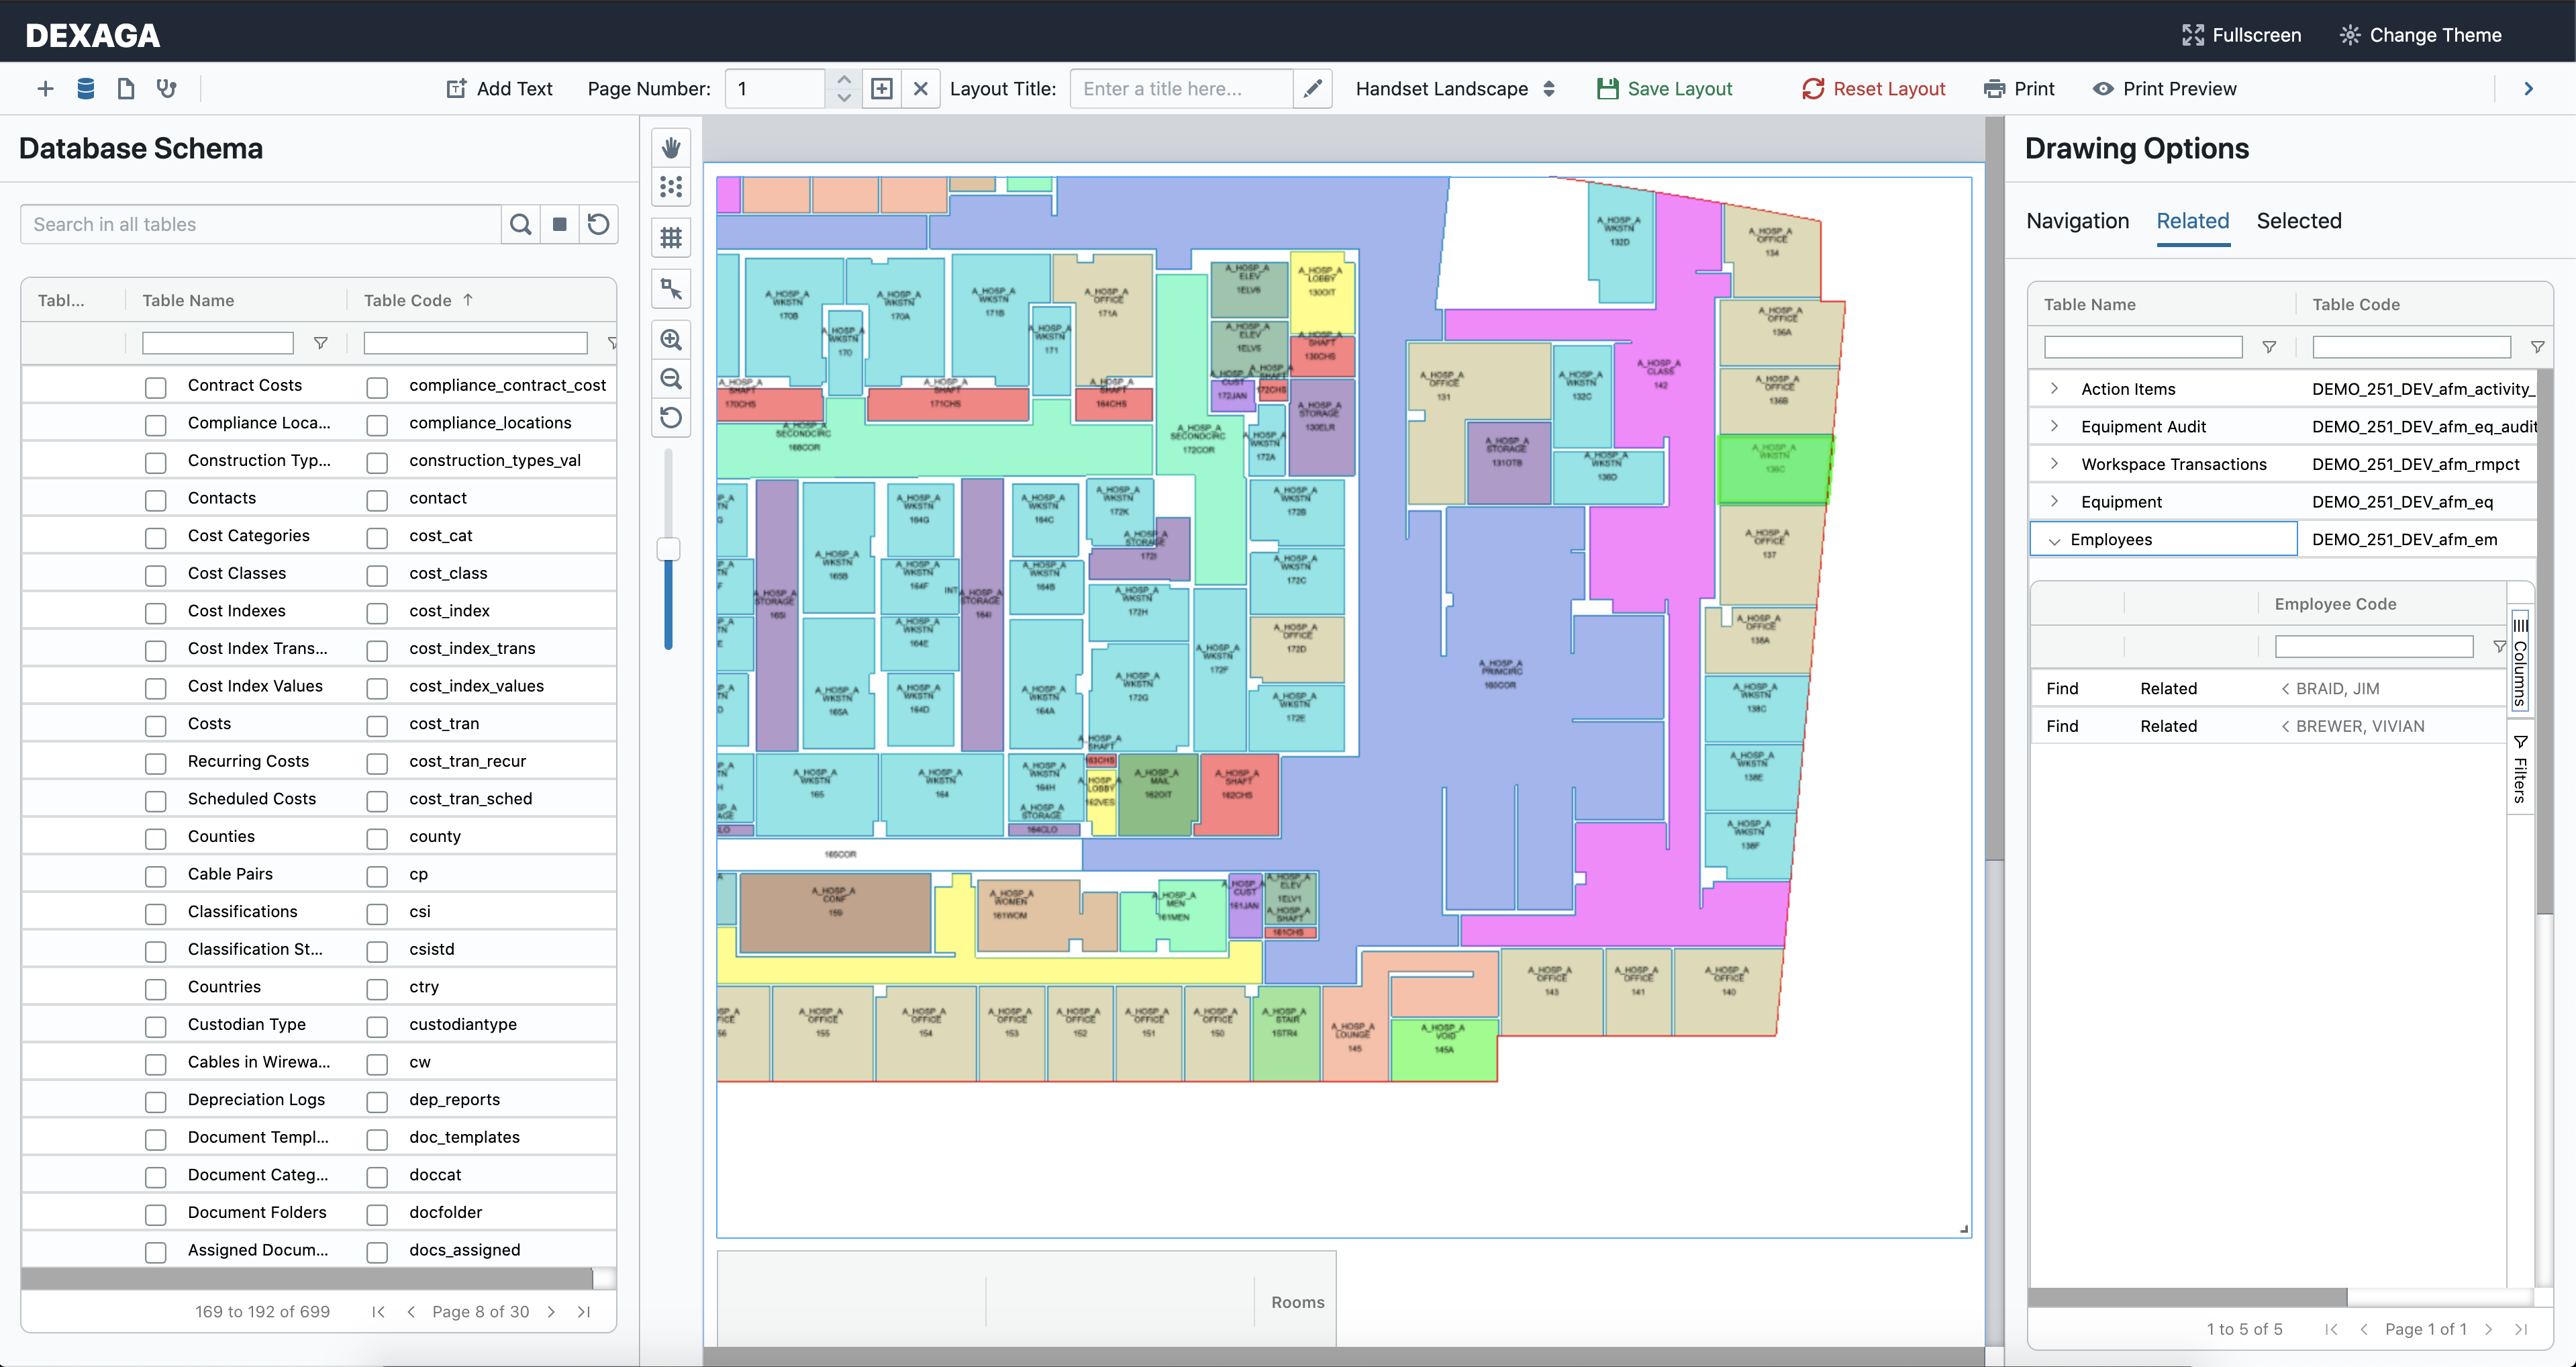
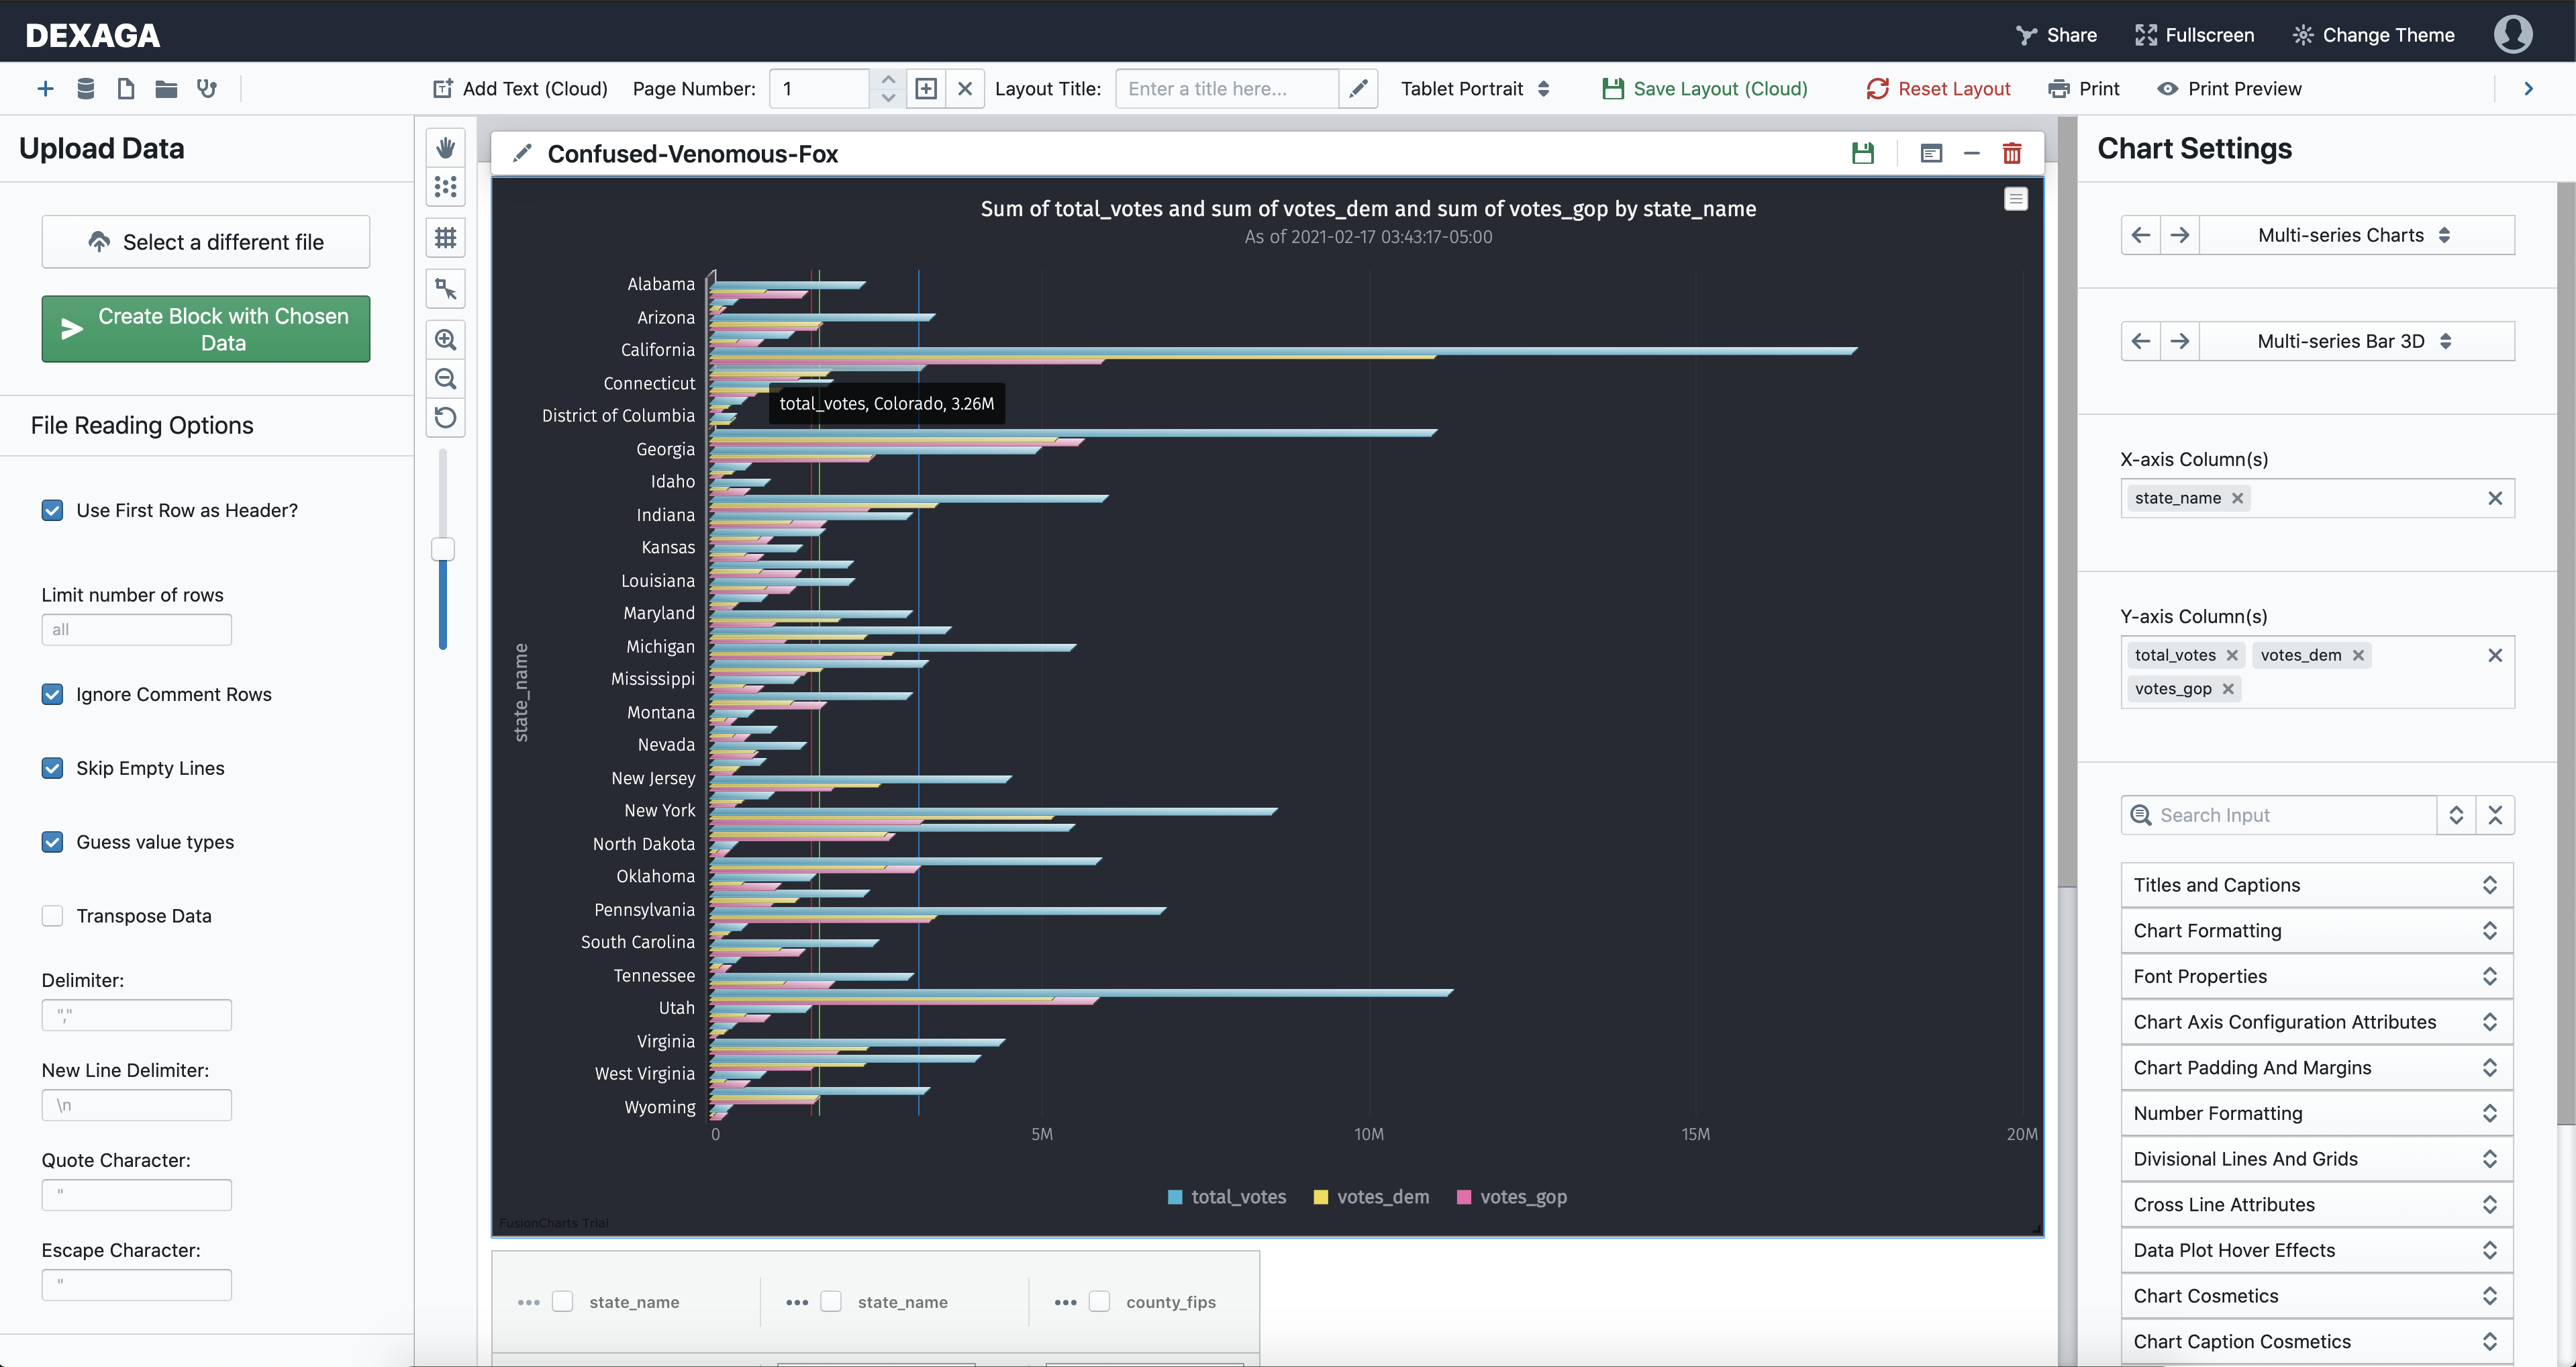
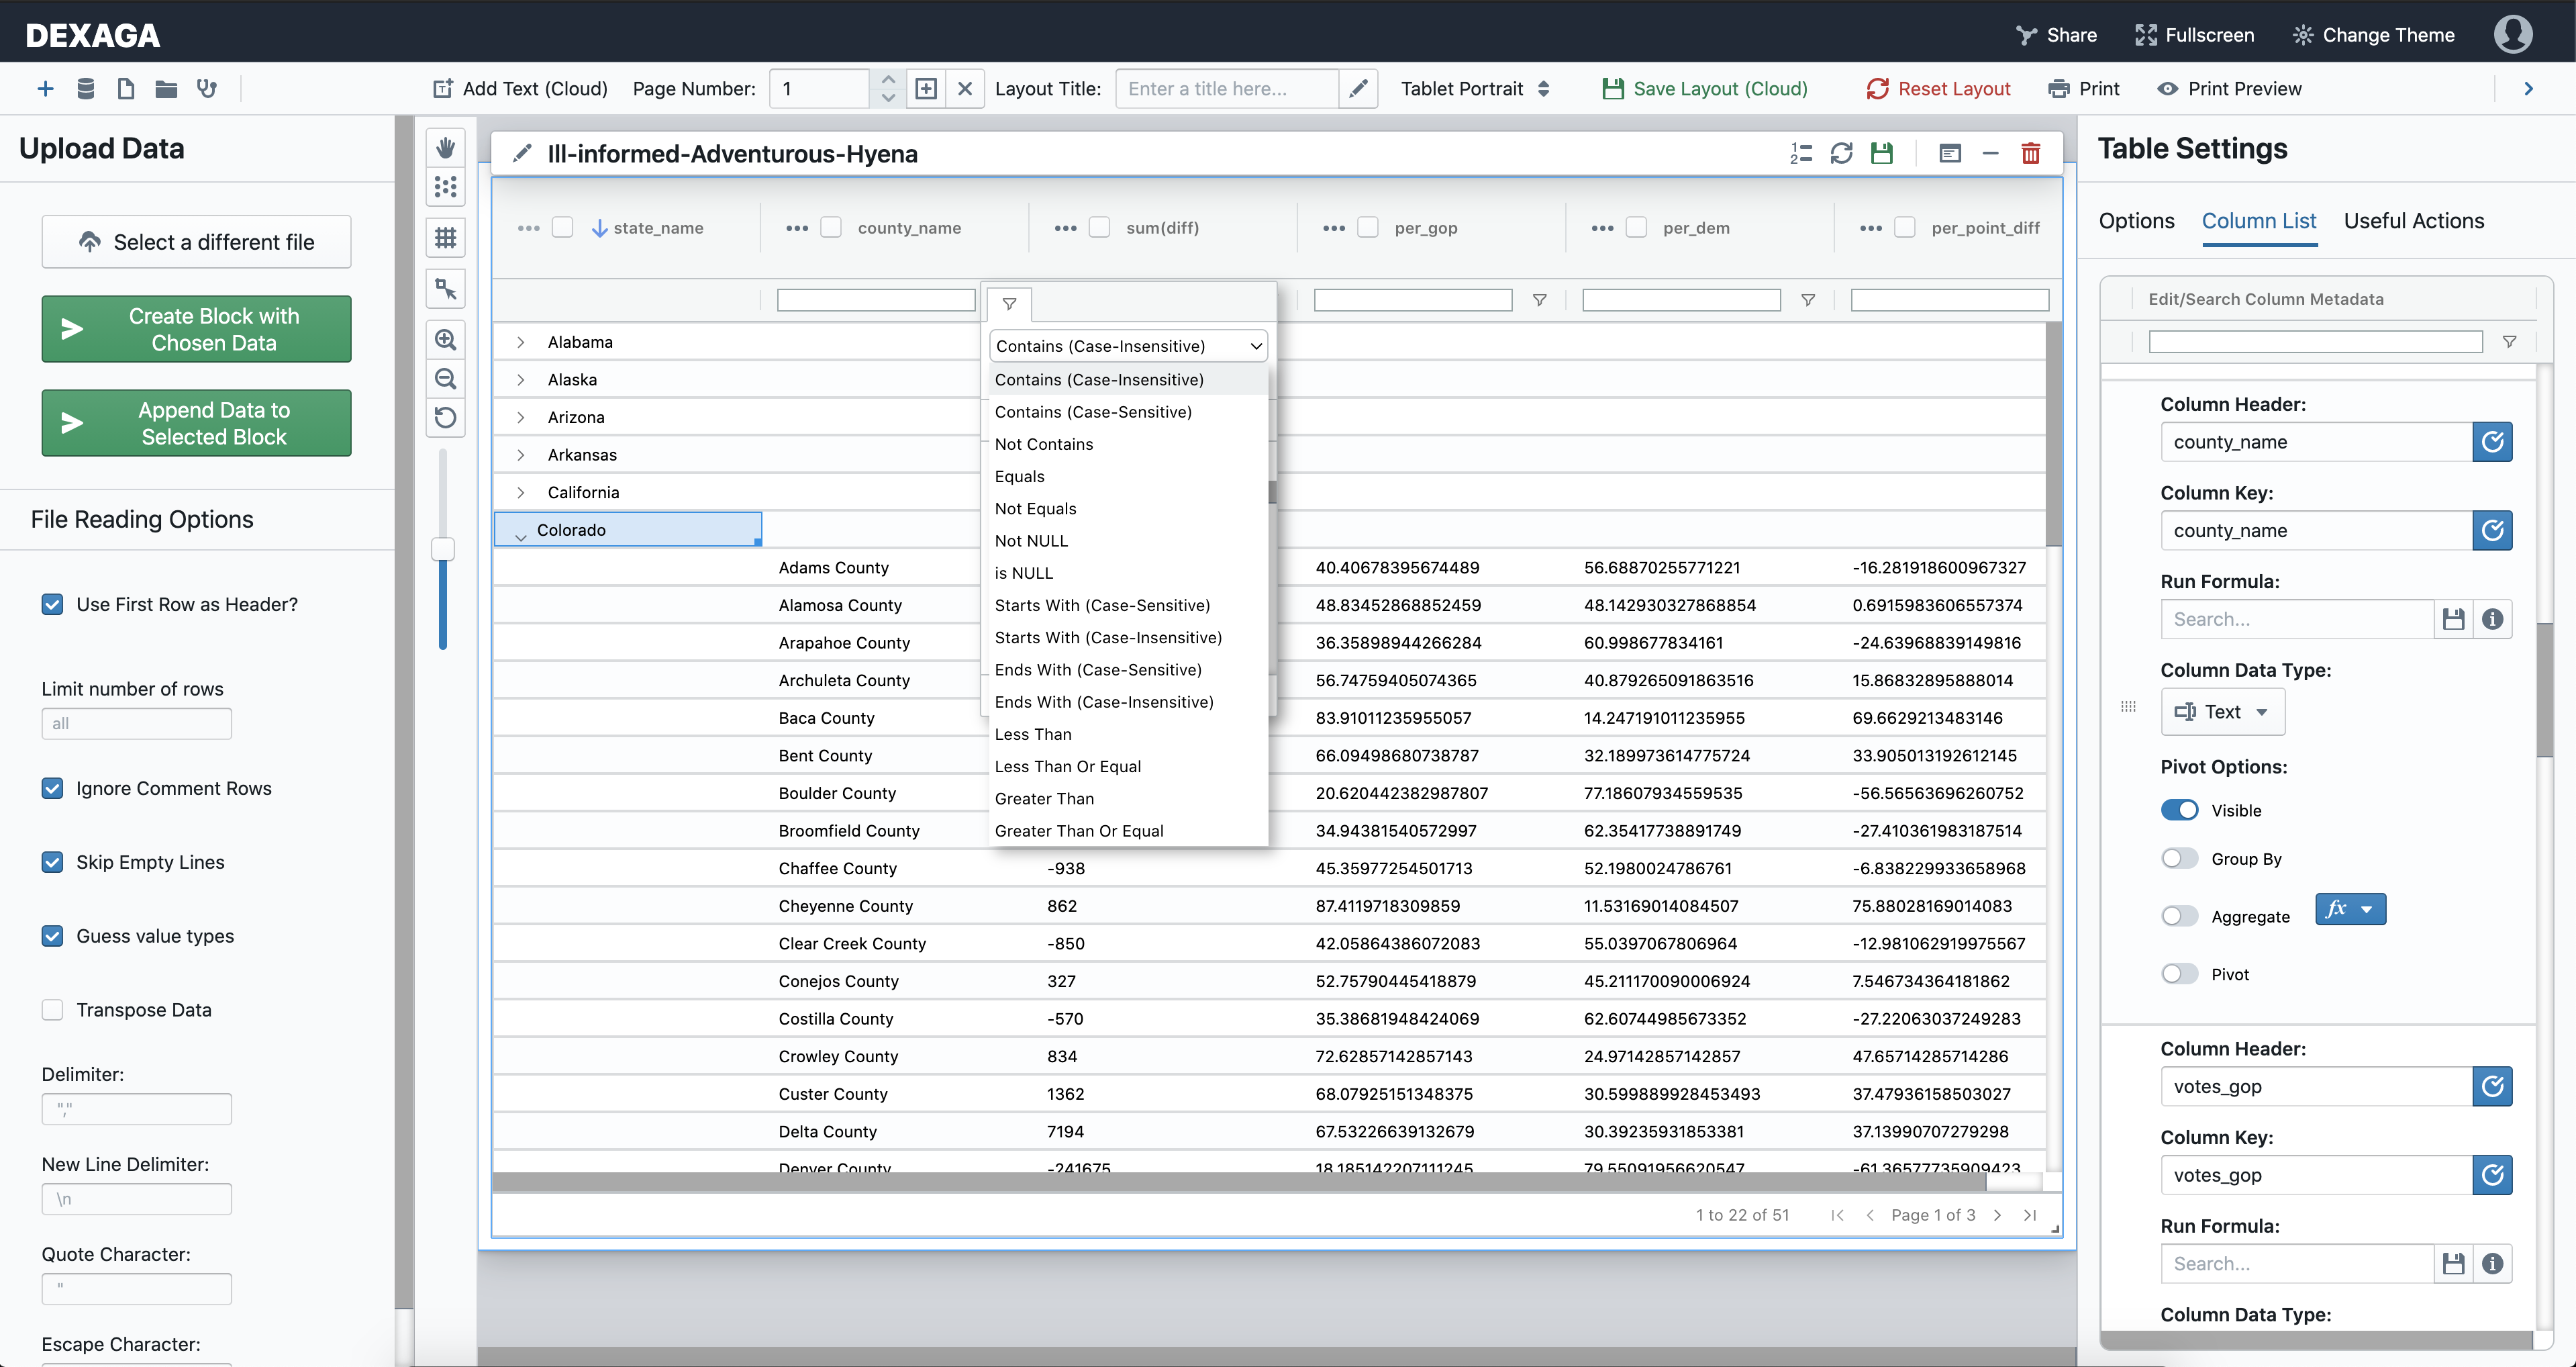
Dexaga is a data exploration tool designed to help users find and make sense of their data. Users can easily browse, query, and aggregate information. Dexaga also includes the ability to cross reference that data with location information to infer and display where a particular object is as well as what is related to that object. Our users particularly like that this is all possible without the need to know a querying language like SQL.

Core Capabilities:

Developing Maps

Is your data better visualized geographically?

Map blocks offer a highly-configurable data overlay which lets users visualize their data over the earth by country, county, latitude/longitude and other methods, saving analysts a few steps.

Compiling Datasets

Would you benefit from handling your data without heavy database or programming skills?

With Dexaga, you can easily explore, sort, filter and pivot your data in real-time with just a few clicks.

Assembling Dashboards

Does making weekly and monthly reports end up costing your organization a lot of time and resources?

Dexaga features the ability to compile your custom datasets, charts and text narrative to tell a story with shareable and printable dashboards all in one place.

Discovering Charts

Have you ever had trouble determining what type of chart best represents your data?

Dexaga was designed to build multiple charts simultaneously in real-time as you interact with the data so you can easily determine the best way to visually represent a dataset.

Contact Us

We would love to hear from you!